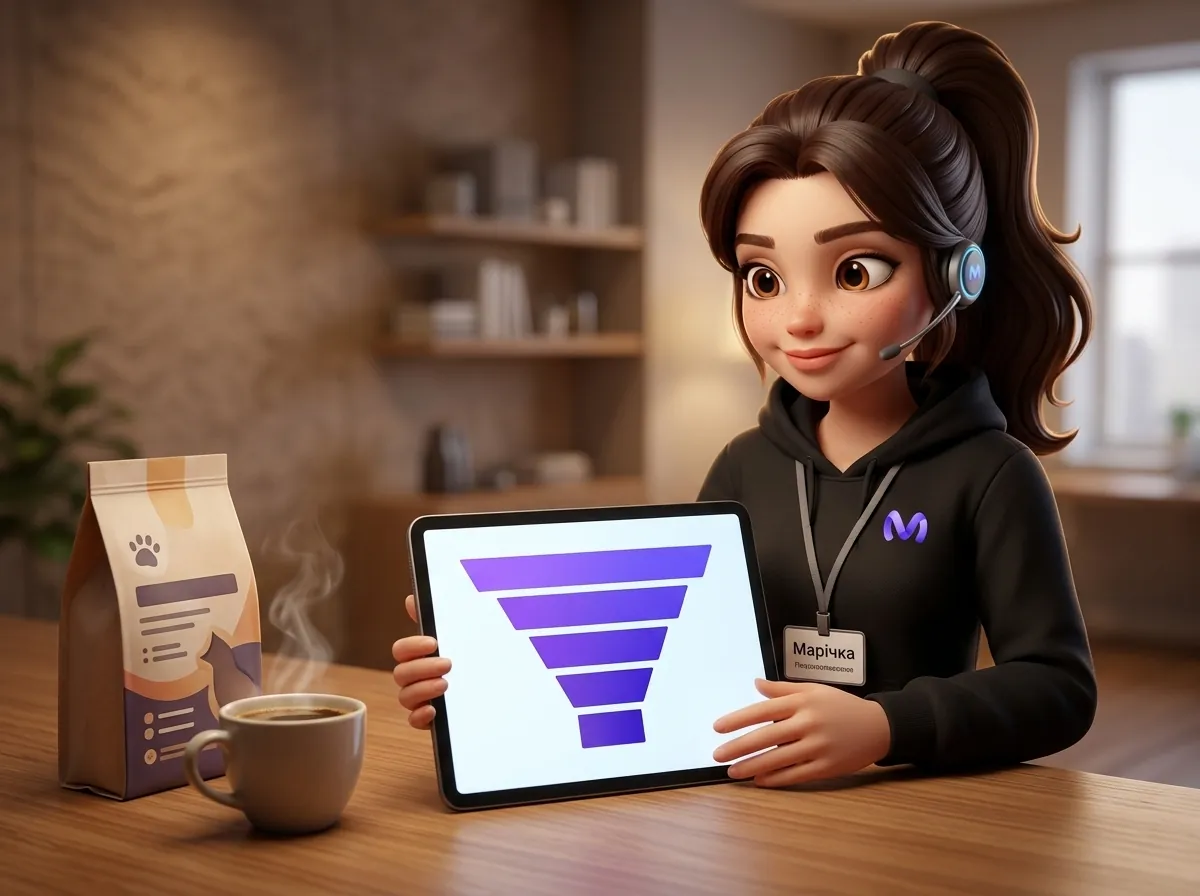
A sales funnel is the sequence of steps a customer goes through from their first contact with a shop to making a payment, and the number of people at each of these stages. There are plenty of people at the start: they see adverts, browse profiles and visit the website. Only a fraction of them go on to make a payment, which is why the diagram is drawn in the shape of a funnel – wide at the top and narrow at the bottom.
A diagram on its own is of no use. It only becomes useful when you assign a number to each stage and can see where the most people drop out. That is precisely why the sales funnel is, first and foremost, a tracking tool, and only secondarily a diagram used in a marketer’s presentation.
Let’s look at an example. Andriy runs a small pet shop: pet food, accessories and beds. He sells via Instagram and his website; orders are managed in the CRM, whilst manager Iryna handles enquiries via Direct and Viber. Advertising generates a lot of messages, but Andriy feels there aren’t enough orders. He doesn’t know where people go between asking “how much does this pet food cost?” and making a payment. Let’s walk through the stages with him, right up to the final calculation.
Contents
- The six stages a pet shop customer goes through
- Where did the model come from, and what does it not show?
- How to calculate the sales funnel in a single week
- Sales funnel example: Andriy’s week in figures
- Where do customers tend to leave most often?
- What parts of the funnel can be handed over to the AI manager?
- How to name the stages in CRM so that the figures don’t mislead
- Frequently asked questions
Section: AI for business
The six stages a pet shop customer goes through
For a shop that sells via messaging apps, the customer journey can be conveniently divided into six stages. Each of these can be quantified as a separate figure, and that is where their value lies.
Back to the first post
The first stage – a person has seen the shop: an advert, a post, a story, or a search result. Andriy takes this figure from Instagram statistics and the advertising dashboard. In the second stage, the person takes an interest: they visit the profile, open the website or view a product page. There’s usually the biggest drop-off between these stages, and that’s normal. Most people just scroll through their feed.
A conversation via Direct
The third stage is the most important one for a shop using messaging apps: the customer has sent a message. “Do you have grain-free food for kittens?”, “What size harness do you have for a dachshund?” The fourth stage is the consultation: the customer has received a substantive reply and knows how much the food will cost, including delivery. Between these two stages lies a gap that shop owners often overlook. A message has been received, but the reply came three hours later, or it was a template reply without a price.
After payment
Stage five – the order has been placed and paid for (or collected from the post office, if paid on delivery). Stage six refers to a repeat purchase. This is particularly important for a pet shop: a bag of dog food runs out roughly every month, and the dog owner returns to buy more time and time again. Anyone who has bought once and is satisfied easily becomes a regular customer, provided they are reminded in good time.
The six stages are not set in stone. Some people combine the first two, whilst others add “added to basket” for a website. The main requirement is that there must be a source for the figures at each stage.
Where did the model come from, and what does it not show?
The concept of successive stages in the purchasing process was described as early as the turn of the 19th and 20th centuries by authors of books on advertising and sales techniques. The best-known formula is AIDA: attention, interest, desire, action. For almost a century, its authorship was attributed to the advertising executive E. St. Elmo Lewis and dated to 1898. This version originates from a book by the psychologist Edward Strong, published in 1925.
In 2024, the Japanese marketing historian Akinori Iwamoto of Kansai University examined Lewis’s writings from 1897 to 1910 and found no evidence to support this version. According to his conclusion, published in A Review of the History of Marketing in Japan…Sales trainer Arthur Frederick Sheldon is more closely associated with the origin of the story. For Andriy’s shop, the story’s origins are of no consequence. What matters is this: the sales staff came up with the model to explain a conversation with a particular customer, and only afterwards did they draw it using a funnel.
The second thing worth knowing concerns the model’s limitations. In their report *Decoding Decisions*, researchers at Google, in collaboration with the consultancy firm The Behavioural Architects, described the period between the initial impulse to buy and the actual purchase as the “messy middle”. During this phase, people go round in circles: searching, comparing, going back. The authors advise shortening the path from the initial impulse to the purchase so that the buyer spends less time looking at competitors’ offers.
For Andriy, the conclusion is simple. A potential customer might send a direct message, go off to compare prices, come back in two days’ time and make a purchase. The funnel doesn’t show this cycle; it merely records which stage the person has reached in your data. That’s enough to identify a weak spot.
How to calculate the sales funnel in a single week
You can analyse your sales funnel without an analyst or new software: all you need are three sources of data and a single spreadsheet. Instagram and the advertising dashboard provide statistics on reach and clicks through to your profile or website. The number of new conversations can be seen in Direct Messages, Viber and in the CRM, provided it syncs messages. Orders and payments are stored in the CRM.
The most common mistake is to use figures from different periods. Monthly reach, weekly conversations, “approximate” orders. Andriy agreed on a rule with Iryna: they count from Monday to Sunday, every Monday morning, and each figure comes from just one source.
The second condition is to define uniformly what constitutes a stage. “Wrote” means a new message from someone who is not yet in the customer database. “Received advice” means that the conversation covered price, availability and delivery method. If Irina replied, “Hello, I’ll check that for you now,” and then went offline, no consultation took place.
It’s worth analysing each channel separately, at least to begin with. Someone who clicks on an Instagram advert and someone who finds the website via a search engine behave differently: the former is more likely to send a direct message with a photo of the product, whilst the latter is more likely to add the product to their basket themselves. If you lump them together into a single sales funnel, a failure in one channel will be masked by the normal figures from the other.
Next, the conversion rate between stages is calculated: divide the number of people at the next stage by the number at the previous stage and multiply by 100. The overall conversion rate is calculated from the first stage through to payment. However, it is the intermediate figures that are most useful for decision-making, as they reveal at which stage a failure occurs.
Sales funnel example: Andriy’s week in figures
The figures in the table are for illustrative purposes only; they have been chosen to demonstrate the calculation. You will obtain your own figures from your own statistics and CRM, and they will be different.
The table starts with the second stage: Andriy tracks reach separately, as it depends on advertising. Repeat purchases within a single week aren’t visible either; it’s better to look at them once a month. However, the “wrote” stage is split into two steps so that we can see how many people actually waited for a reply.
| Stage | People per week | Conversion from the previous stage |
|---|---|---|
| You have been redirected to the profile or the website | 1 200 | – |
| Send us a message via Direct or Viber | 140 | 11,7 % |
| We received our first reply within an hour | 95 | 67,9 % |
| We have received the price, stock availability and delivery details | 80 | 84,2 % |
| We have placed and paid for the order | 30 | 37,5 % |
The overall conversion rate from click-through to payment in this example is 2.5 per cent. On its own, this figure doesn’t tell us much. The intermediate figures, however, reveal a great deal.
A third of those who wrote in had to wait over an hour for a reply: the table shows that forty-five people asked questions and did not receive a reply in time. Some of them most likely bought pet food from another shop that very evening, whilst Iryna was already at home.
The second drop-off is evident between the consultation and payment: in the example involving eighty people who received all the information, thirty went on to pay. It’s worth taking a look at the actual conversations here. Perhaps delivery turned out to be more expensive than expected, or perhaps the person asked for “some time to think about it” and nobody followed up with them.
Andriy realised that it would be cheaper to sort out the first problem. There’s no need to change the advert or the product range. We need to respond more quickly, especially in the evening when Iryna is no longer on duty.
Where do customers tend to leave most often?
For shops that sell via messaging apps, losses usually centre on four key points in a conversation, and you can check these within an hour by reviewing the chat history from the past week. More often than not, it’s the speed that lets them down: a message received at 10.00 pm won’t be seen by Irina until the next morning, by which time the customer will have already found another shop. The second pitfall is a reply without a price: requests such as “please let me know your dog’s weight” are perfectly legitimate, but if there’s still no price in the second message, some customers will drop off. The third pitfall lies in delivery: the price of the food is acceptable, but the delivery charge isn’t, and the customer only finds out about it at the last minute, when they were already ready to buy. The fourth, and cheapest to rectify, pitfall is the silence following a “I’ll think about it”: no one gets back to the customer a day later with a quick question or a reminder.
The website has its own stage in the sales funnel, and conversion rates there are traditionally low. According to data from eSputnik, as reported by Ekonomichna Pravda (29 October 2026), the median conversion rate for Ukrainian online shops in terms of purchases stood at around 1.1 per cent at the start of 2026. The sample covers 946 e-commerce and retail companies. In other words, out of every hundred website visitors, approximately one makes a purchase. Someone who has messaged you directly has already gone further than a casual website visitor, so losing them is particularly disappointing.
For Andriy’s pet shop, two of the four issues turned out to be the main ones: slow responses and silence after a consultation. These are the ones that should be addressed first.
What parts of the funnel can be handed over to the AI manager?
The AI sales manager takes over two stages of the sales funnel: the initial contact and the consultation. The rest is still handled by people and the CRM system.
In Andriy’s case, it works like this. The Marichka AI sales manager connects to Instagram Direct and Viber, and functions as a widget on the website. According to the product description on the website, it responds within 10–30 seconds at any time of day. It accesses the product catalogue from the website or from an Excel or PDF file, with prices and stock levels updated automatically. So, when someone asks about grain-free pet food at half past ten in the evening, they receive a specific product listing with a price. The reply “the manager will get back to you in the morning” disappears from the chat. When the customer is ready, the order is created in the CRM, and Irina sees it in the same list as the daytime orders. If there’s a complex issue (such as a pet’s allergy, non-standard delivery or a complaint), the AI manager forwards it to Irina along with the conversation history.
As for that, how an AI agent guides a customer from the first message to an order, we’ve written about this separately. And if you want to work out in hryvnias what happens to unanswered messages, start by analysing what, How much do requests cost that nobody replied to overnight?.
What an AI manager won’t change: the top of the funnel and prices. If your adverts are attracting the wrong people, or if delivery is more expensive than your competitors“, a quick response won’t fix that. So first, analyse your sales funnel and make sure that the main bottleneck really is at the ”wrote but didn’t get a reply’ stage. Only then will the AI manager’s test show an accurate result based on those same figures.
How to name the stages in CRM so that the figures don’t mislead
In CRM, the sales funnel is represented by the statuses of deals or orders: each status corresponds to a stage. Terms such as “lead”, “qualification” and “pipeline” from English-language templates are often confused within a small team. A sales funnel in Ukrainian, with action-based names that any employee can understand, works better.
Andriy and Iryna settled on the following statuses: “New enquiry”, “Price quoted”, “Awaiting decision”, “Paid”, “Dispatched”, “Repeat purchase”. Each status describes an event that can be checked in the chat. They removed the “Warm lead” status because everyone interpreted it differently.
Rule two: the status is updated by the person who carried out the action. Irina rang and arranged payment, so she is the one who sets the status to “Awaiting decision” or “Paid”. If an order is created in the CRM by a programme, such as an AI manager, check in advance what status it is assigned when it enters the system. Otherwise, orders placed overnight will end up in a separate column and won’t appear in the Monday report. Then, on Monday, the status report will match reality without the need for manual recalculation.
The funnel doesn’t sell for you. It shows at which stage the shop is losing customers. You can then focus on improving that one specific stage, and the changes will be visible in the very next weekly report. Start with last week: extract five figures from Instagram and your CRM, calculate the conversion rates between stages, and identify the biggest drop-off. That’s where you should start.

Ready to connect Marichka to your channel?
Marichka AI will help you automate communication, reply to clients 24/7 and increase sales.
Frequently asked questions
What is a sales funnel, in simple terms?
This is a list of the steps a person goes through from their first encounter with the shop to making a payment, showing the number of people at each stage. The title explains the pattern: there are lots of people at the entrance, but only a small proportion make it to the checkout. This is tracked to see at which stage the most customers are lost.
How many stages should there be in the sales funnel for a small shop?
Usually, five or six steps are enough: they see it, get interested, get in touch, receive advice, pay, and make a second purchase. It only makes sense to have more steps if there is a separate metric in the CRM for each one and a specific person responsible for it.
How does a sales funnel differ from CRM?
A sales funnel is a model of the customer journey, whilst a CRM is a programme where you manage orders and contacts. In a CRM, the sales funnel is configured as a set of deal statuses, and the status report then shows how many people are at each stage. You can also calculate the sales funnel without a CRM, but this has to be done manually and is prone to error.
How often should the funnel be emptied?
For a shop that receives dozens of enquiries a day, it’s convenient to do this once a week, on the same day and covering the same period. Daily figures fluctuate too much, whilst monthly figures arrive too late, by which time lost customers have already bought elsewhere.